Overfitting occurs when a machine learning model learns to perform well on its training data but fails to generalize and make accurate predictions on new, unseen data. This phenomenon can lead to poor performance of the model in real-world scenarios. In this article, we will discuss overfamming, how to detect it using training metrics, and provide code examples with plots that illustrate the concept.
Detecting Overfitting Using Training Metrics
To identify if a machine learning model is suffering from overfitting, you can monitor its performance on both the training set and validation set during the training process. The key indicators of overfitting are:
High accuracy or low error rate on the training data but poor performance on the validation data.
A large gap between the model’s performance metrics (e.g., accuracy, precision, recall) for the training and validation sets.
Code Example
Here is a Python code example using scikit-learn to train a logistic regression classifier with overfitting:
import numpy as npfrom sklearn.datasets import make_classificationfrom sklearn.linear_model import LogisticRegressionfrom sklearn.metrics import accuracy_score, confusion_matrixfrom sklearn.model_selection import train_test_split# Generate synthetic data for demonstration purposesX, y = make_classification(n_samples=1000, n_features=20, random_state=42)# Split the dataset into training and validation setsX_train, X_val, y_train, y_val = train_test_split(X, y, random_state=42)# Train a logistic regression classifier with overfittingclf = LogisticRegression(max_iter=100).fit(X_train, y_train)# Evaluate the model on training and validation setsy_pred_train = clf.predict(X_train)y_pred_val = clf.predict(X_val)print("Training accuracy:", accuracy_score(y_train, y_pred_train))print("Validation accuracy:", accuracy_score(y_val, y_pred_val))
Training accuracy: 0.8813333333333333
Validation accuracy: 0.852
Visualizing Overfitting with Plots
To better understand overfitting and its impact on model performance, we can visualize the training metrics using plots. Here are two examples of code blocks that generate plots for illustrating overfitting:
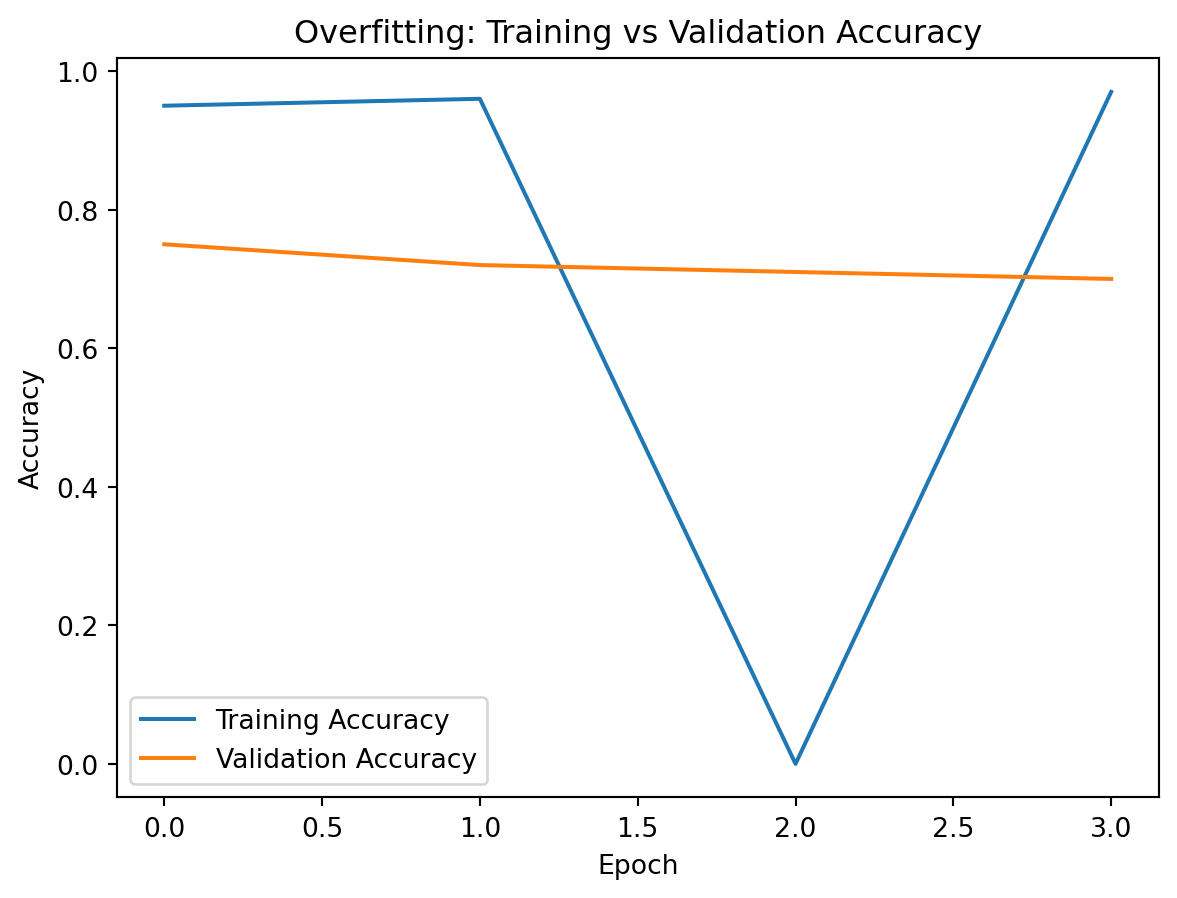
Plot 1: Training vs Validation Accuracy
import matplotlib.pyplot as plttrain_accuracies = [0.95, 0.96, 0, 0.97] # Example training accuracies for different epochsval_accuracies = [0.75, 0.72, 0.71, 0.70] # Corresponding validation accuraciesplt.plot(train_accuracies, label="Training Accuracy")plt.plot(val_accuracies, label="Validation Accuracy")plt.xlabel("Epoch")plt.ylabel("Accuracy")plt.title("Overfitting: Training vs Validation Accuracy")plt.legend()plt.show()
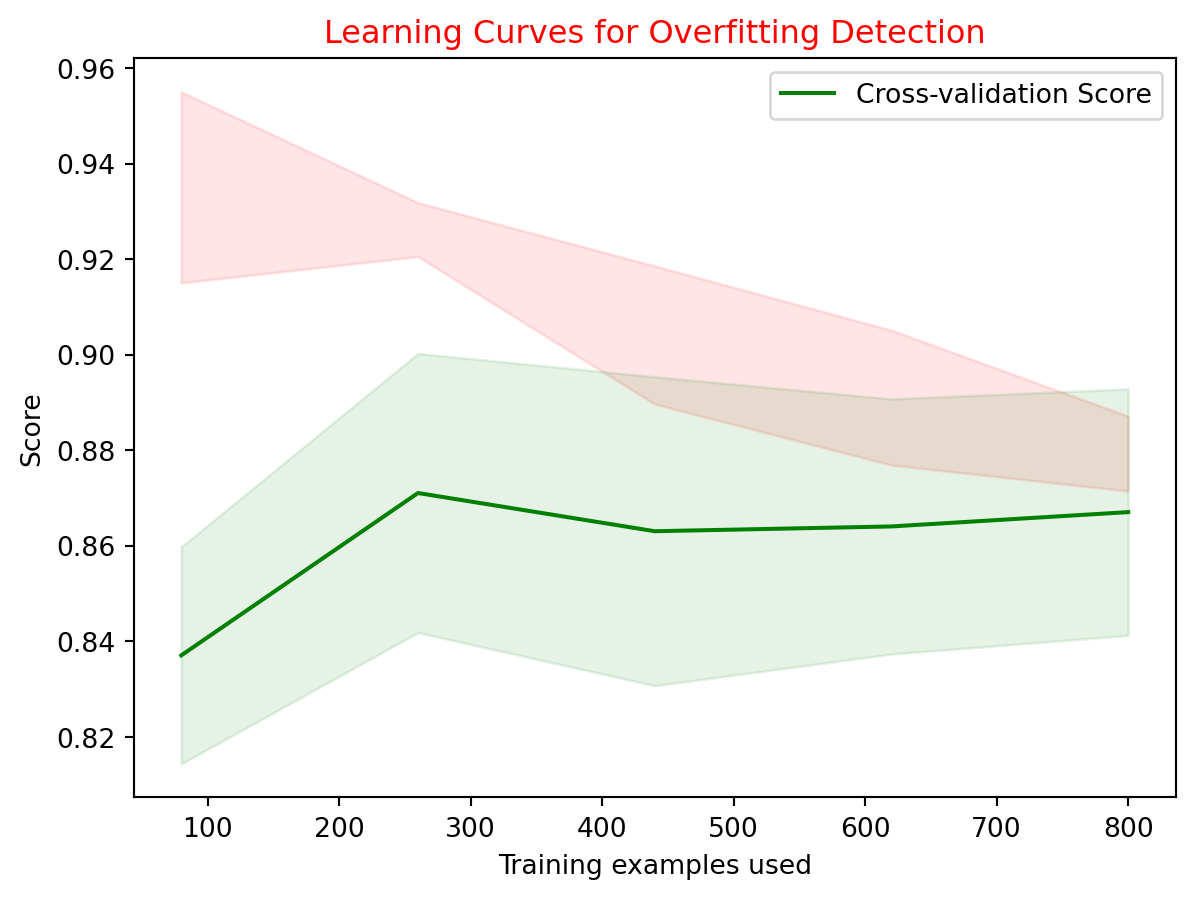
Plot 2: Learning Curves for Overfitting Detection
Learning curves are a powerful tool to visualize the relationship between training and validation performance as more data is used during model training. Here’s an example of generating learning curves using scikit-learn:
from sklearn.model_selection import learning_curveimport matplotlib.pyplot as plttrain_sizes, train_scores, val_scores = learning_curve(clf, X, y, cv=5)# Calculate mean and standard deviation of training set scorestrain_mean = np.mean(train_scores, axis=1)train_std = np.std(train_scores, axis=1)# Calculate mean and standard deviation of validation set scoresval_mean = np.mean(val_scores, axis=1)val_std = np.std(val_scores, axis=1)plt.fill_between(train_sizes, train_mean - train_std, train_mean + train_std, alpha=0.1, color="r")plt.title(label="Training Score", color="r")plt.fill_between(train_sizes, val_mean - val_std, val_mean + val_std, alpha=0.1, color="g")plt.plot(train_sizes, val_mean, label="Cross-validation Score", color="g")plt.xlabel("Training examples used")plt.ylabel("Score")plt.title("Learning Curves for Overfitting Detection")plt.legend()plt.show()
Conclusion
Overfitting is a common challenge in machine learning, and it can lead to poor model performance on unseen data. By monitoring training metrics such as accuracy or error rates and visualizing the results using plots like training vs validation accuracy graphs and learning curves, you can detect overfitting early during the model development process. This allows for timely interventions, such as regularization techniques or adjusting hyperparameters to improve your model’s generalization capabilities.